
eBPF in 2026: The Linux Superpower Every Backend Developer Should Understand
What eBPF actually is, how it lets you trace and observe a running Linux kernel safely, and why every backend developer should have at least one bpftrace one-liner in their toolkit.
On this page
A few months back I had a Node service that was randomly stalling for a couple hundred milliseconds every few minutes. No exceptions, no error logs, nothing in the APM dashboard worth screenshotting. Application-level tracing was useless because the problem wasn’t in the application — it was somewhere between the syscall layer and the disk. The tool that actually cracked it open wasn’t a new logging library or a fancier metrics agent. It was a single bpftrace one-liner that hooked into the kernel’s block I/O layer and printed exactly which process was blocking on which device, in real time, with basically zero overhead. That was the moment eBPF stopped being “that thing Cilium and Falco use under the hood” for me and became a tool I reach for directly.
If you write backend software and you’ve never had a reason to learn eBPF, 2026 is a good year to fix that. It’s no longer a niche kernel-hacker curiosity — it’s the plumbing underneath a huge slice of modern cloud infrastructure, and understanding even the basics changes how you debug production systems.
What Is eBPF, Actually
eBPF stands for “extended Berkeley Packet Filter,” which is a historically accurate but almost actively misleading name at this point. The original BPF, from 1992, was a tiny virtual machine for filtering network packets efficiently — tcpdump still uses its filter syntax today. eBPF took that idea and blew it wide open: instead of a narrow packet-filtering VM, it’s now a general-purpose, sandboxed virtual machine that runs inside the Linux kernel itself, and it can attach to almost any kernel event you care about — syscalls, function entry/exit, scheduler decisions, network packets, disk I/O, memory allocation, USB events, you name it.
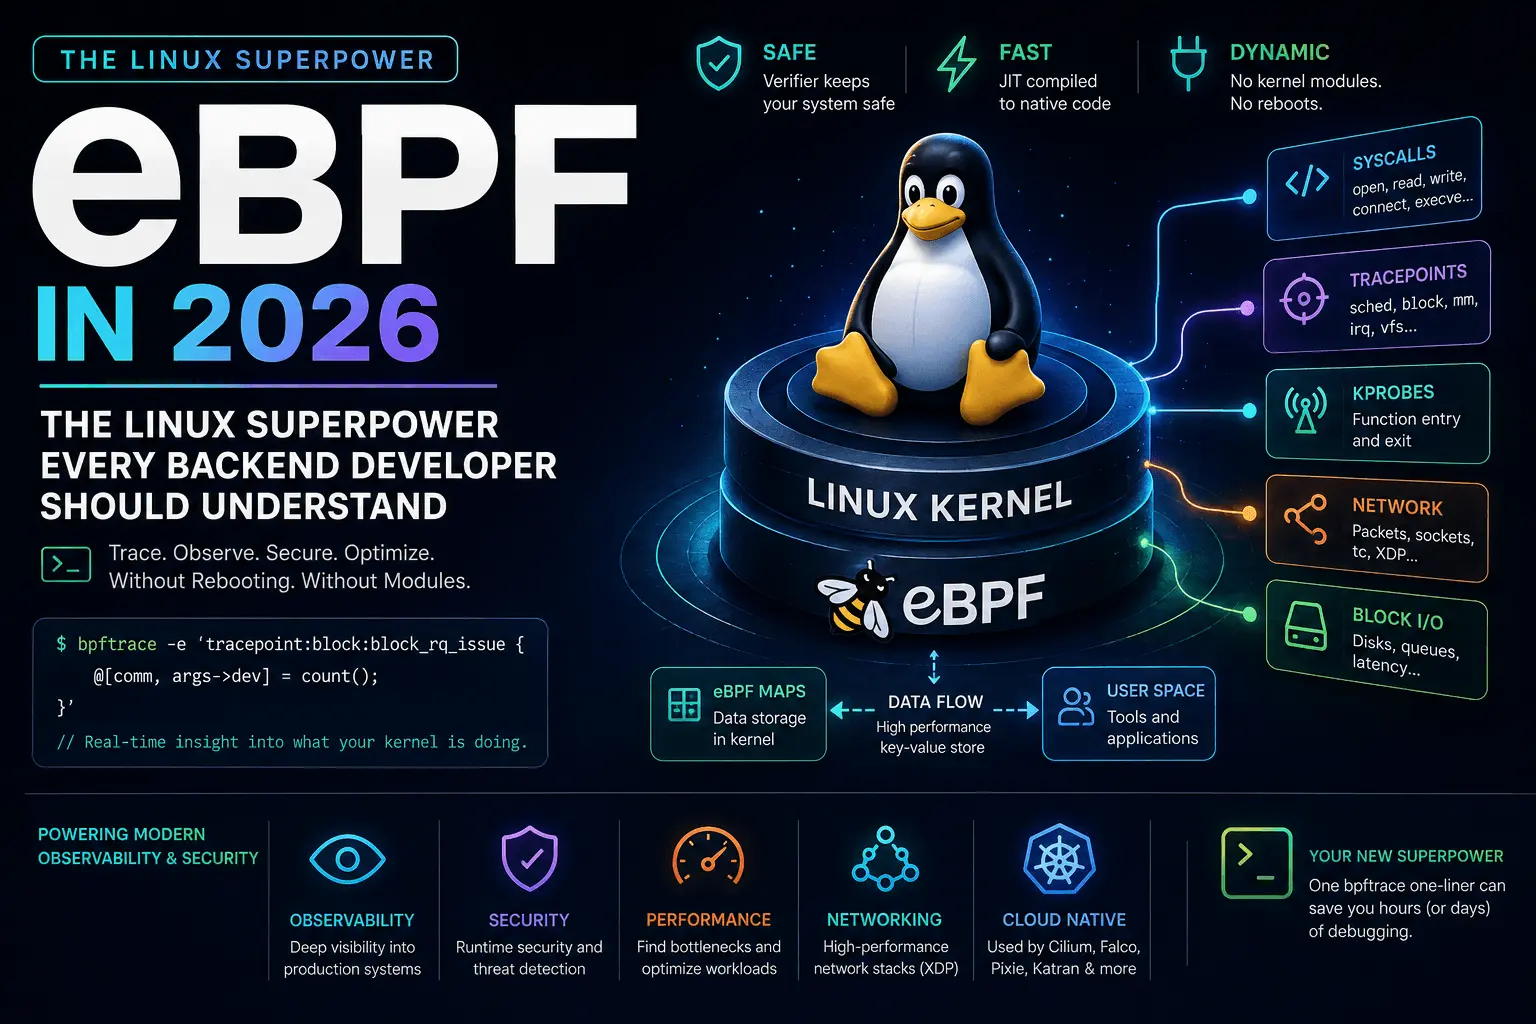
The pitch in one sentence: eBPF lets you run custom, safety-checked code inside the kernel, triggered by kernel events, without writing a kernel module and without recompiling or rebooting the kernel.
That last part is the whole story. Before eBPF, if you wanted deep visibility into what the kernel was doing — real syscall-level tracing, custom network packet processing, fine-grained security enforcement — your options were: write a kernel module (risky, can crash the whole box, needs a reboot or at least a careful unload/reload cycle), use existing tracing frameworks that were either too coarse (strace, with its massive overhead) or too limited (static tracepoints only), or patch and rebuild the kernel yourself. eBPF gives you kernel-level programmability with none of those downsides, because the kernel verifies your program before it’s allowed to run.

How eBPF Actually Works Under The Hood
The mechanics are worth understanding even at a high level, because they explain both why eBPF is safe and why it’s fast.
You Write In A Restricted C-Like Language, Compiled To Bytecode
eBPF programs are usually written in a restricted subset of C (or increasingly, via higher-level frontends like bpftrace’s own scripting language, or Rust via the aya crate) and compiled with LLVM into eBPF bytecode. That bytecode is what actually gets loaded into the kernel.
The Verifier Is The Whole Safety Story
Before any eBPF program is allowed to run, the kernel’s verifier statically analyzes it. It walks every possible execution path and rejects the program if it can’t prove things like: the program terminates (no unbounded loops — historically this meant no loops at all, though bounded loop support has expanded over the years), it never accesses memory out of bounds, it never dereferences an unchecked pointer, and it stays within a fixed instruction-count budget. This is the single biggest reason eBPF is trusted in production kernels: a buggy eBPF program can’t crash your box or read memory it shouldn’t, because the verifier refuses to load it in the first place. This is a fundamentally different safety model than a kernel module, where a bad pointer dereference takes down the whole machine.
JIT Compilation Makes It Fast
Once verified, the bytecode is JIT-compiled to native machine code for your architecture, so a running eBPF program executes at close to native speed — not interpreted, not going through a slow trap-and-emulate path. This is why eBPF-based tools have such low overhead compared to older tracing approaches: you’re not adding a userspace round-trip for every event, you’re running compiled code directly at the hook point inside the kernel.
Maps Move Data Between Kernel And Userspace
eBPF programs are stateless and short-lived by design — they run, do their thing, and exit. To persist data (counters, histograms, aggregated stats) or share it with a userspace program, they use eBPF maps: kernel-resident key-value data structures (hash maps, arrays, ring buffers, per-CPU variants) that both the kernel-side program and a userspace controller process can read and write. This is how a tool like bpftrace collects data from thousands of kernel events per second and shows you an aggregated histogram without flooding userspace with individual messages.
eBPF vs kprobes, uprobes, and Static Tracepoints
It’s worth being precise about terminology here because these terms get thrown around loosely.
- Tracepoints are static, pre-defined hook points that kernel developers explicitly add to the source (e.g.,
sched_switch,block_rq_issue). They’re stable across kernel versions but limited to wherever a maintainer decided to put one. - kprobes (kernel probes) let you dynamically attach to almost any kernel function’s entry or return, even ones without a tracepoint. Hugely flexible, but the attach points aren’t a stable ABI — they can shift between kernel versions.
- uprobes are the userspace equivalent — dynamic probes on functions inside userspace binaries and libraries, useful for tracing application code without a tracepoint or instrumentation built in.
eBPF isn’t a competing mechanism to these — it’s the engine that runs your logic when any of these fire. You attach an eBPF program to a tracepoint, a kprobe, or a uprobe, and the program is what decides what happens next: filter, aggregate, record a timestamp, push to a map. This is exactly why the ecosystem grew the way it did — eBPF gave people a safe, fast, programmable payload to put behind hooks that already existed in fragmented form for years.
The Tools You’ll Actually Use: bpftrace, bpftool, and Friends
You don’t need to write raw eBPF C and hand-roll a verifier-friendly program to get value out of this. Here’s the practical toolchain, roughly ordered from “quick one-liners” to “production infrastructure.”
bpftrace — The Interactive, One-Liner-Friendly Tool
bpftrace is a high-level tracing language built on eBPF, inspired heavily by awk and DTrace syntax. It compiles your one-liner or script into eBPF bytecode, loads it, runs it, and tears it down when you’re done. This is the tool for the “something weird is happening right now on this box” investigation.
A classic example — count syscalls by process name, live, system-wide:
sudo bpftrace -e 'tracepoint:raw_syscalls:sys_enter { @[comm] = count(); }'
Or the one that actually solved my disk-stall mystery — trace block I/O requests over 100ms with the offending process name:
sudo bpftrace -e '
kprobe:blk_account_io_start { @start[arg0] = nsecs; @pid[arg0] = pid; }
kprobe:blk_account_io_done /@start[arg0]/ {
    $dur = (nsecs - @start[arg0]) / 1000000;
    if ($dur > 100) {
        printf("PID %d: block IO took %d ms\n", @pid[arg0], $dur);
    }
    delete(@start[arg0]); delete(@pid[arg0]);
}'
That’s the whole investigation. No agent to deploy, no sidecar, no recompiling anything — you attach, observe, and detach, with sub-microsecond overhead per event.
bpftool — Inspecting What’s Loaded
bpftool is the lower-level administrative tool — list loaded eBPF programs and maps, dump their bytecode, inspect what’s attached where. This is what you reach for when you’re auditing a box and want to know “what eBPF programs are already running on this machine and who put them there” — increasingly relevant since so much infrastructure (your CNI plugin, your security agent, your service mesh) is quietly running its own eBPF programs already.
BCC — The Original Toolkit
BCC (BPF Compiler Collection) predates bpftrace and ships a library of ready-made Python-and-C tracing tools — execsnoop, opensnoop, tcplife, biolatency — each one purpose-built for a specific class of question. If bpftrace is the scripting shell, BCC’s tools are the pre-packaged utilities. Many teams still keep both installed; BCC’s tools are great defaults, bpftrace is what you reach for when none of them fit your exact question.

Where eBPF Shows Up In Production Infrastructure You Already Use
This is the part that surprises people the most: if you run anything on Kubernetes or in a modern cloud environment, you’re almost certainly running eBPF already, whether you know it or not.
Networking — Cilium. Cilium replaces the traditional iptables/kube-proxy path in Kubernetes with eBPF programs attached at the network interface level, doing packet routing, load balancing, and network policy enforcement directly in the kernel data path. The performance difference versus iptables-chain-based networking at scale is not subtle — iptables rule evaluation is roughly linear in the number of rules, while eBPF-based lookups stay closer to constant time via hash maps.
Security — Falco and Tetragon. Runtime security tools like Falco and Cilium’s Tetragon use eBPF to observe syscalls and process lifecycle events system-wide, flagging suspicious behavior (a shell spawned inside a container that shouldn’t spawn shells, an unexpected outbound connection) in real time, again with far lower overhead than the auditd-based approaches that came before.
Observability — Pixie, Parca, and continuous profilers. Whole-cluster observability tools increasingly use eBPF to auto-instrument applications without any code changes — capturing HTTP/gRPC traffic, building service maps, and doing continuous CPU profiling by sampling stack traces via eBPF at a fixed frequency, all without an SDK in your application code.
Performance — the classic Brendan Gregg toolkit. The biolatency, tcptop, runqlat, and dozens of other BCC/bpftrace tools that show up in every “Linux performance” talk are all eBPF under the hood, and they’re the reason systems performance debugging looks completely different than it did a decade ago.
A Practical Comparison: Old Tools vs eBPF-Based Tools
| Task | Old approach | eBPF approach | Why it’s better |
|---|---|---|---|
| Trace syscalls | strace |
bpftrace / BCC |
strace can slow a process 10-100x; eBPF overhead is near-zero |
| Network policy | iptables chains |
Cilium (eBPF) | Near-constant-time lookups vs linear rule scans |
| Packet capture/filter | classic BPF (tcpdump) |
eBPF-based capture | Programmable filtering logic, not just match/drop |
| Security auditing | auditd |
Falco / Tetragon | Lower overhead, richer context per event |
| Custom kernel logic | Kernel module | eBPF program | Verified-safe, no reboot, no crash risk |
| App profiling | Manual instrumentation/SDKs | eBPF continuous profilers | Zero code changes required |

Gotchas and Edge Cases Worth Knowing
Kernel version matters, a lot. eBPF capability has grown steadily since it was introduced around Linux 3.18 (2014) and expanded massively from 4.x onward (BPF Type Format / CO-RE support, bounded loops, more helper functions). If you’re targeting older kernels — think some enterprise RHEL/CentOS LTS installs — check what’s actually available before you build tooling around a feature you saw in a recent blog post.
CO-RE (Compile Once, Run Everywhere) solved the portability headache. Early eBPF programs had to be compiled against the exact kernel headers of the target machine, which was miserable for distributing tools across a fleet with mixed kernel versions. CO-RE, built on BTF (BPF Type Format) metadata, lets a single compiled eBPF program adapt its struct offsets at load time to whatever kernel it actually lands on. This is why modern eBPF tools (Cilium, recent BCC/bpftrace builds) can ship one binary that works across kernel versions instead of requiring a rebuild per host.
Not everything needs root, but a lot still does. Unprivileged eBPF has expanded over the years (certain program types can run without CAP_SYS_ADMIN under CAP_BPF/CAP_PERFMON splits), but most of the interesting tracing programs — kprobes, most network hooks — still need elevated privileges. Don’t assume you can hand this to just anyone on a shared box.
The verifier can reject perfectly correct programs. Because it’s doing static analysis of every path, sufficiently complex programs sometimes get rejected not because they’re wrong, but because the verifier can’t prove they’re safe within its complexity budget. Simplifying loop bounds, splitting logic across tail calls, and keeping programs small are common workarounds.
eBPF isn’t free — it’s just cheap. Every attached probe has some cost. It’s typically negligible per-event, but attaching dozens of high-frequency probes (every syscall entry, for instance) on a busy production box adds up. Treat it like any instrumentation: measure before you assume zero impact.
FAQ
Is eBPF only for Linux? Yes, natively — it’s a Linux kernel feature. Windows has an eBPF-for-Windows project inspired by the same model, but it’s a distinct implementation, not the same runtime.
Do I need to write eBPF C code to benefit from it? No. Most developers get everything they need from bpftrace one-liners or existing tools (Cilium, Falco, Pixie) built on top of eBPF. Writing raw eBPF programs is for building new tools, not for day-to-day debugging.
Is eBPF safe to run in production? Yes — that’s the entire design point. The verifier’s static safety guarantees are why companies run eBPF-based agents on every node in large fleets without the crash risk that came with kernel modules.
How is eBPF different from a kernel module? A kernel module is arbitrary, unverified code running with full kernel privileges — a bug can crash the machine. An eBPF program is verified before it loads, sandboxed, resource-bounded, and can be unloaded cleanly at any time.
What’s the easiest way to start learning eBPF? Install bpftrace, and run a few of the one-liners from its examples repo against your own machine. Watching live syscall or I/O activity on a box you understand is the fastest way the concepts click.
Closing Thought
eBPF is one of those technologies that’s already reshaped the infrastructure you depend on, quietly, in the background, while most application-layer developers were never asked to think about it. That’s changing. As more observability, security, and networking tooling moves onto eBPF as its foundation, understanding what it is and roughly how it works stops being a kernel-hacker specialty and starts being basic literacy for anyone debugging production systems on Linux. You don’t need to write a single line of eBPF C to get value out of this — you just need to know that bpftrace exists, and that the next time something is happening at a layer your application logs can’t see, the kernel itself can tell you, if you ask it the right way.